Experimental: ship your Keycloak logs and events to your own OTLP endpoint

We're shipping an experimental Telemetry Export for Enterprise Keycloak clusters. Point it at your own OTLP endpoint and your cluster's Keycloak logs and authentication events start arriving in whatever you already run — OpenSearch, Datadog, Grafana, SigNoz, Elastic, or your own OpenTelemetry Collector.
No agent to install, no log shipper to configure, and nothing to run on your side except the collector you already have.
Why, when the dashboard already shows you this
Observability gave every dedicated cluster metrics and logs in the Phase Two dashboard with zero setup, and for most teams that is the whole answer. But a pattern kept coming back in support conversations, and it was always the same shape:
"Our SOC correlates authentication failures with everything else. Keycloak is the one system where we have to go and look somewhere separate."
That is a fair complaint, and it isn't one a better dashboard fixes. If your incident response starts in Splunk, or your retention policy is written around your own S3 bucket, or your on-call alerting lives in a rule engine that has never heard of us, then the right place for Keycloak data is your system, not ours.
So this feature is deliberately not another view. It is a pipe.
What it looks like
Telemetry Export is part of the Enterprise tier. On Starter and Premium the Logs → Export page shows an upgrade note instead. Compare plans or change your plan from Clusters > Cluster > Config > Subscription.
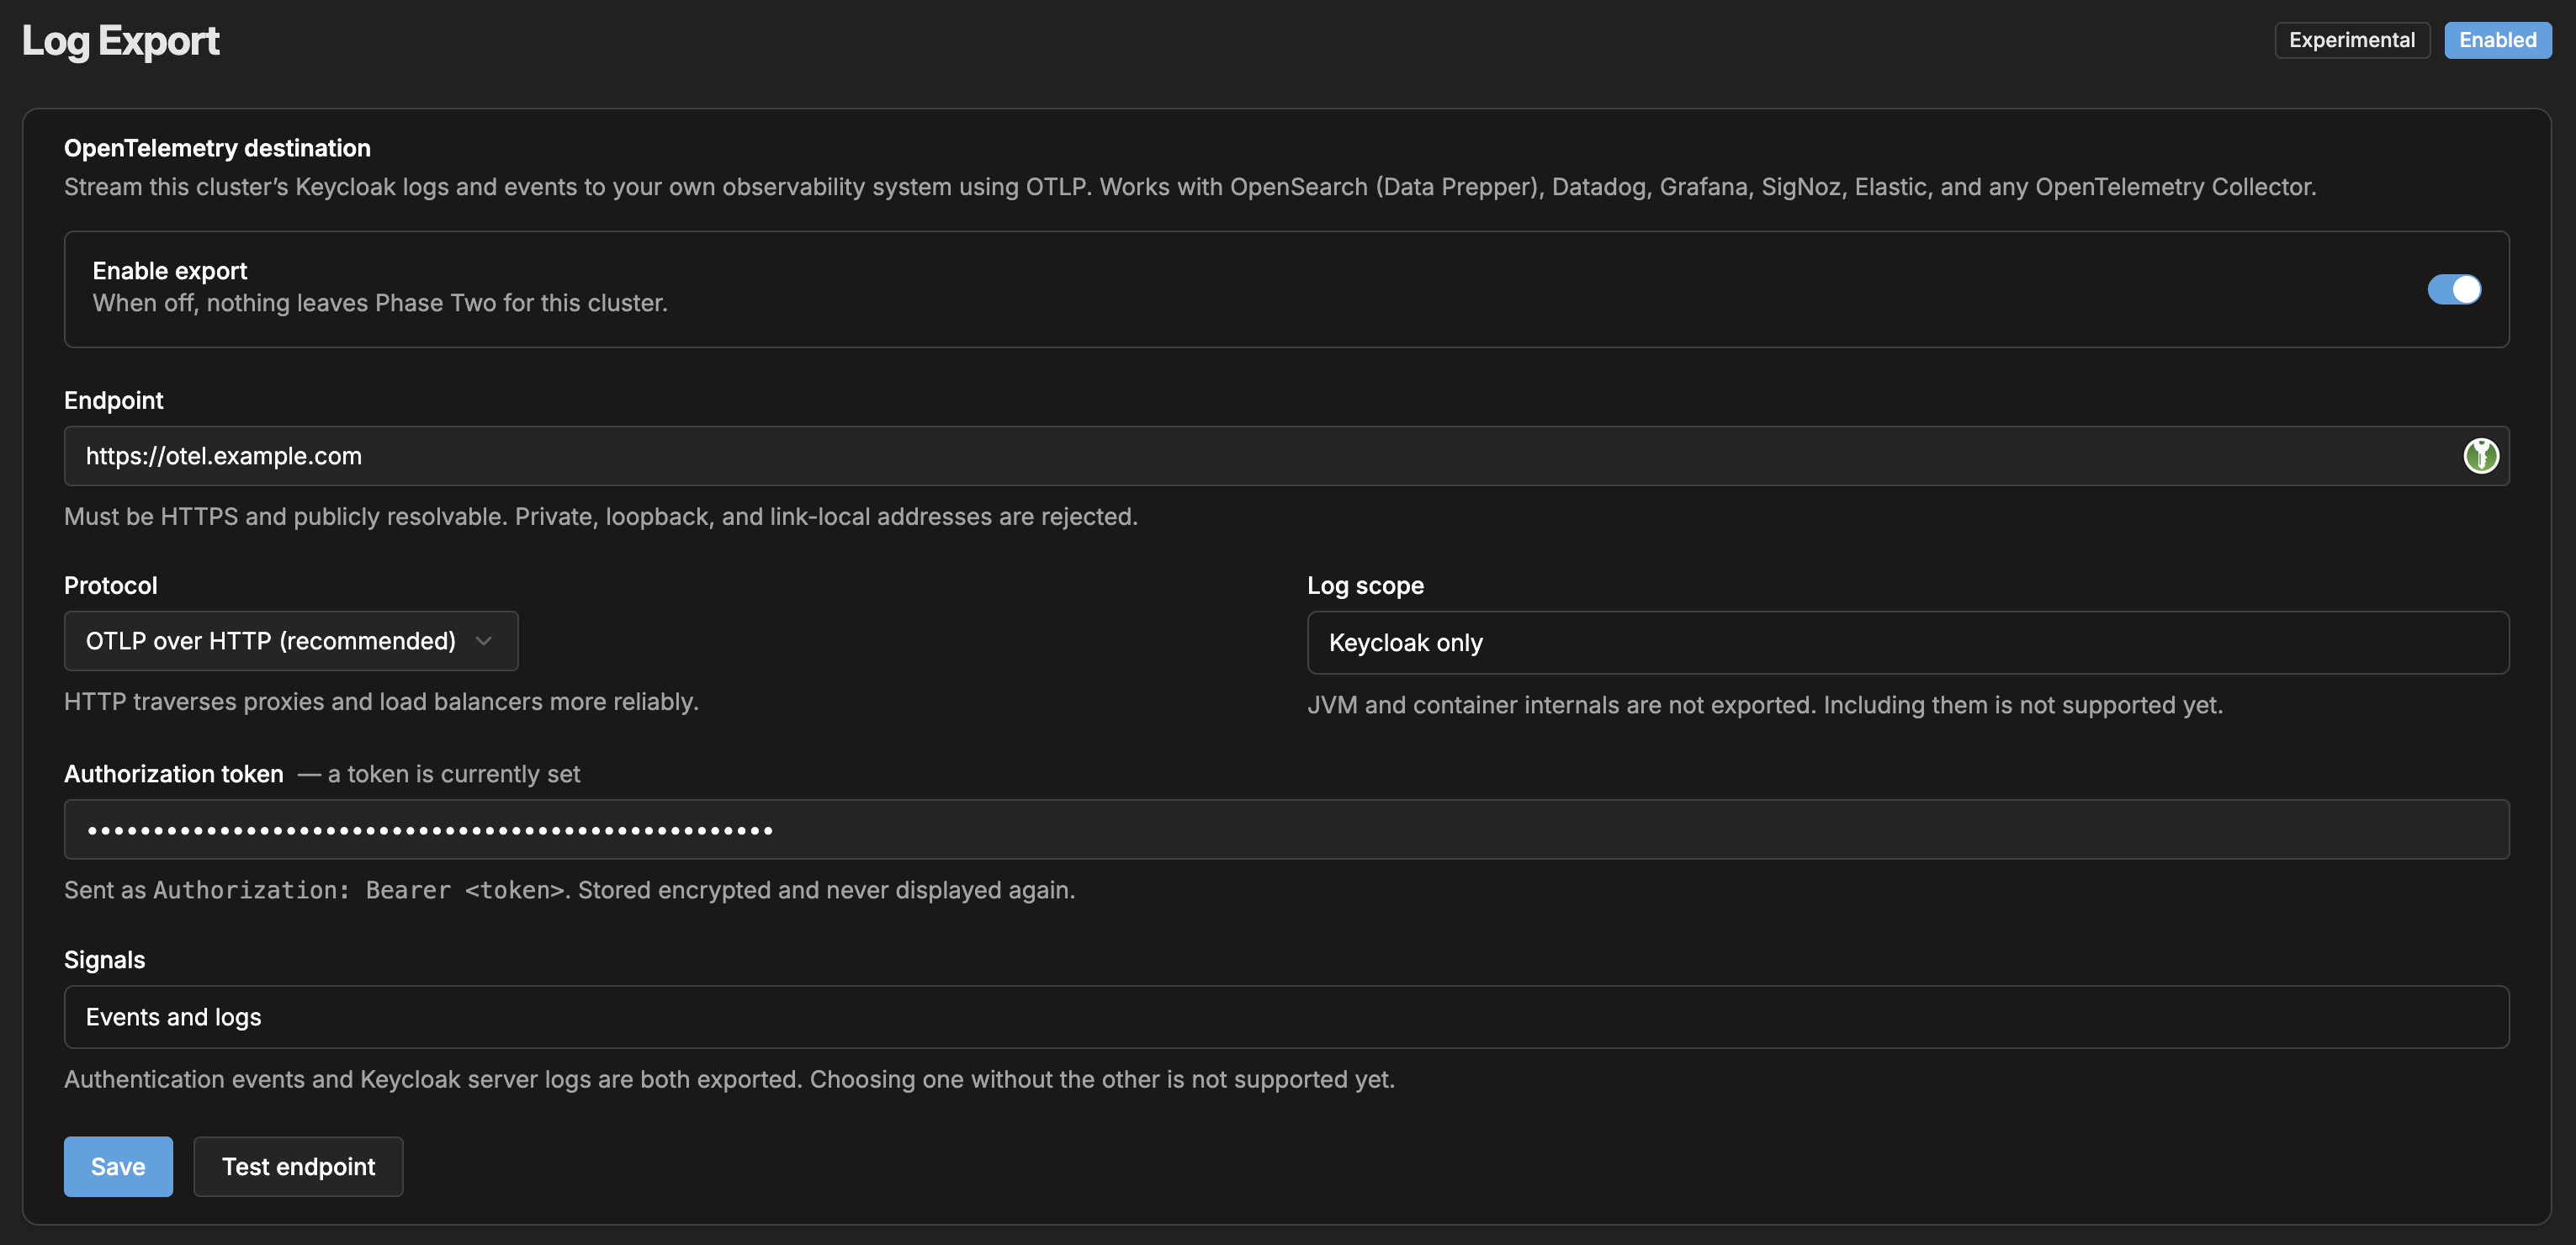
That's the feature. Configuration is data in the control plane, so there is no ticket to file, no Terraform to apply, and nothing on your cluster restarts when you change it. A change takes a couple of minutes to reach the exporter — not instant, and we'd rather say so than round it down.
The data model is the interesting part
OTLP gives you a wire format. It does not tell you what the records should look like, and that's where the design work went.
Everything is the OTLP logs signal. Authentication events are structured log records, not traces. Keycloak doesn't emit traces, and pretending an event is a span helps nobody.
Events are rebuilt, not forwarded. Keycloak emits events into the log stream as a carrier line with a map of fields attached. Forwarding that verbatim would hand you a string to regex. Instead each event is reconstructed into flat attributes:
phasetwo.signal      = "event"
keycloak.event.type  = "LOGIN_ERROR"
keycloak.event.error = "invalid_user_credentials"
keycloak.realm.name  = "customers"
keycloak.user.id     = "…"
keycloak.client.id   = "web-app"
client.address       = "…"
So phasetwo.signal:"event" AND keycloak.event.type:"LOGIN_ERROR" is a first-class query in your backend rather than a pattern match against message text.
Severity is derived for events. Keycloak logs a failed login at INFO, because from the logger's point of view nothing went wrong. That makes severity >= WARN — the single most useful filter anyone writes against this data — match nothing. We set WARN when an event carries an error, and we emit the numeric SeverityNumber alongside the text, because most backends filter on the number and quietly ignore rules built on the text alone.
Event timestamps are the event's time, not the time its log line was written.
Our infrastructure is not in your data. Pod names, node names, internal addresses, and account identifiers are excluded by an allowlist rather than a blocklist — so a field some future Keycloak version adds is excluded by default rather than leaked by default. You should not have to understand our deployment topology to query your own logs.
What happens when your endpoint goes down
It will, eventually, and the honest answer matters more than the optimistic one.
Records queue on disk in your cluster's region and are retried indefinitely. Nothing is lost while your collector is away, and nothing is lost by anyone else either — each destination has its own queue and its own retry state, so one broken endpoint cannot affect another customer or the dashboard views you already rely on.
If an endpoint stays down long enough for that queue to fill, the oldest records are discarded. For a typical cluster that is days rather than hours. We alert on both the stall and the drop and will get in touch — but we deliberately don't claim to know what happened after delivery. If your collector accepts a record and your pipeline drops it downstream, that looks like success from here.
What "experimental" means here
Concretely:
- Enterprise only. Not available on Starter or Premium.
- The attribute names and record shape may change in a backwards-incompatible way. If you build dashboards on
keycloak.event.typetoday, expect to revisit them. - Logs and events are all or nothing. You cannot take events without logs yet.
- Logs only. No metrics, no traces.
- One destination per cluster. Fan out with a collector on your side.
- No filtering, sampling, or redaction options. Records go as Keycloak produces them — which means exported events contain end-user IP addresses and user IDs in the clear. Make sure the destination is a place those belong under your own obligations.
The pipeline itself is running in all our production regions and delivering. The experimental label is about the contract, not the plumbing.
Try it
When this was published, Telemetry Export had to be switched on per account. It is now self-serve on every Enterprise cluster: open Logs → Export and configure it yourself. Nothing to email, nothing to wait for.
Open Logs → Export on an Enterprise cluster, enter your endpoint and token, and save. If you tell us what you're sending it to we would still like to hear it — the backend you name genuinely shapes what we build next, particularly around per-signal selection and attribute mapping — but it is no longer a gate.
On Starter or Premium and want to try it? Email support@phasetwo.io. We would rather hear the use case than have you assume the answer is no.
The full reference, including every attribute, the delivery semantics, and the endpoint requirements, is in Telemetry Export.
And if your collector lives behind a firewall, our egress IP addresses are published and stable.