Observability for Keycloak, with Zero Setup

Today we're launching Observability for dedicated Keycloak clusters — built directly into the Phase Two dashboard with zero setup. Requests, event data, and live logs are all there the moment your cluster is running. No agents to install, no log shippers to configure, no Prometheus, Grafana, or Loki stack to stand up and maintain.
This is the feature we're most excited about this year, because of what it changes about getting Keycloak into production. Standing up the observability layer around a Keycloak cluster — metrics pipelines, log aggregation, dashboards, alerting — is the kind of work that normally takes a devops team weeks to months. With Phase Two, it's already done. Getting up and running on a fully observable Keycloak cluster is now a matter of minutes.
Available for Dedicated Clusters Observability is included with all Phase Two dedicated cluster plans. Open the Metrics or Logs section on your cluster in the self-service dashboard to get started.
See your whole system at a glance
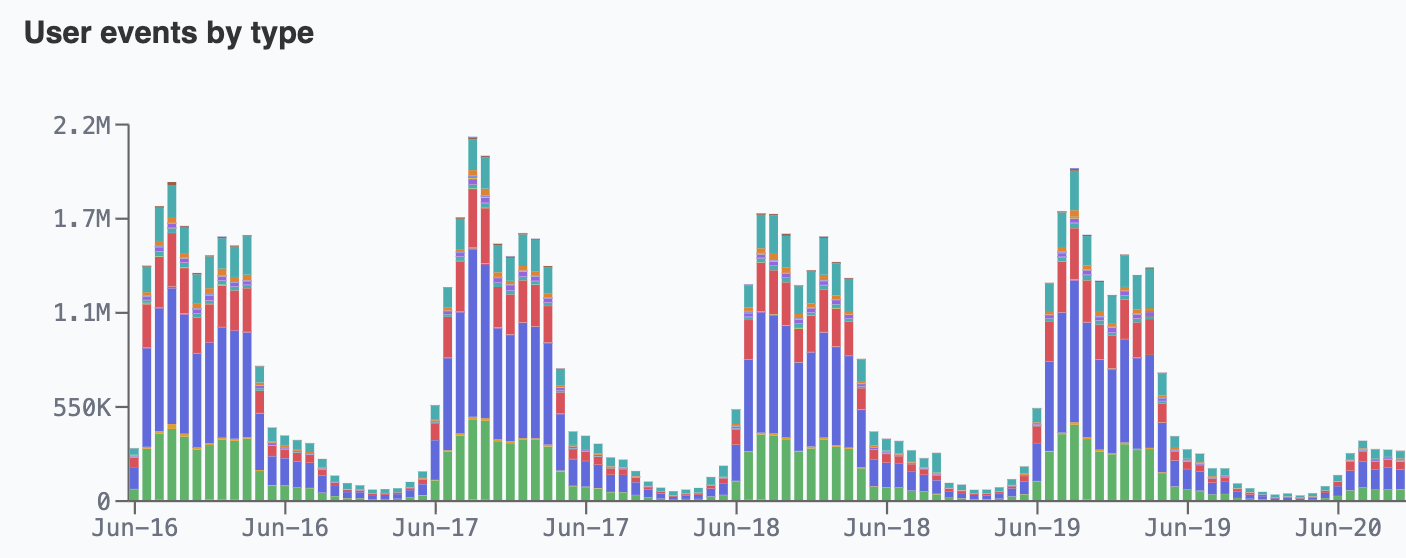
Start with the big picture: understanding what your cluster is doing, at a glance, without building a single chart yourself.
Event Metrics chart Keycloak authentication and admin activity over any time range: user events by type, successful and failed logins, active users per day, new registrations, password resets, MFA enrollment, and login-error reasons.
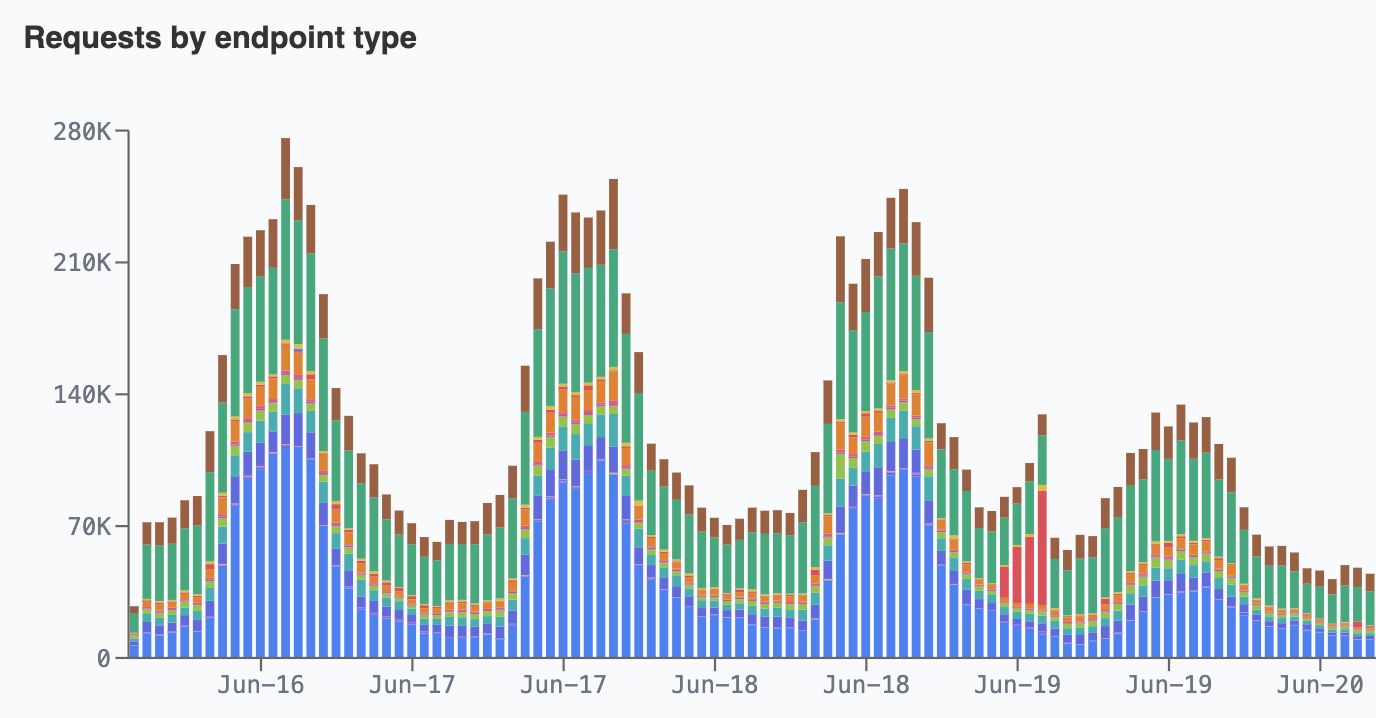
Request Metrics chart the HTTP traffic and performance of the cluster: requests by endpoint type and status class, error rate, cache hit ratio, latency and TTFB percentiles (p50 / p95 / p99), bytes served, top endpoints, and top user agents.
Spot an anomaly in a chart, then drop straight into the logs to find the exact requests and events behind it. The metrics tell you something changed; the logs tell you exactly what.
Debugging that takes minutes, not days
When something goes wrong with an authentication flow — a login that fails intermittently, a theme that won't load, a token error that only some users hit — the slowest part has always been seeing what actually happened. Traditionally that meant SSH-ing into nodes, grepping through container logs, or waiting for someone with cluster access to pull the right files.
Phase Two Observability collapses that loop. Open the Logs section, filter to the realm and time window, and watch the relevant lines stream in live.
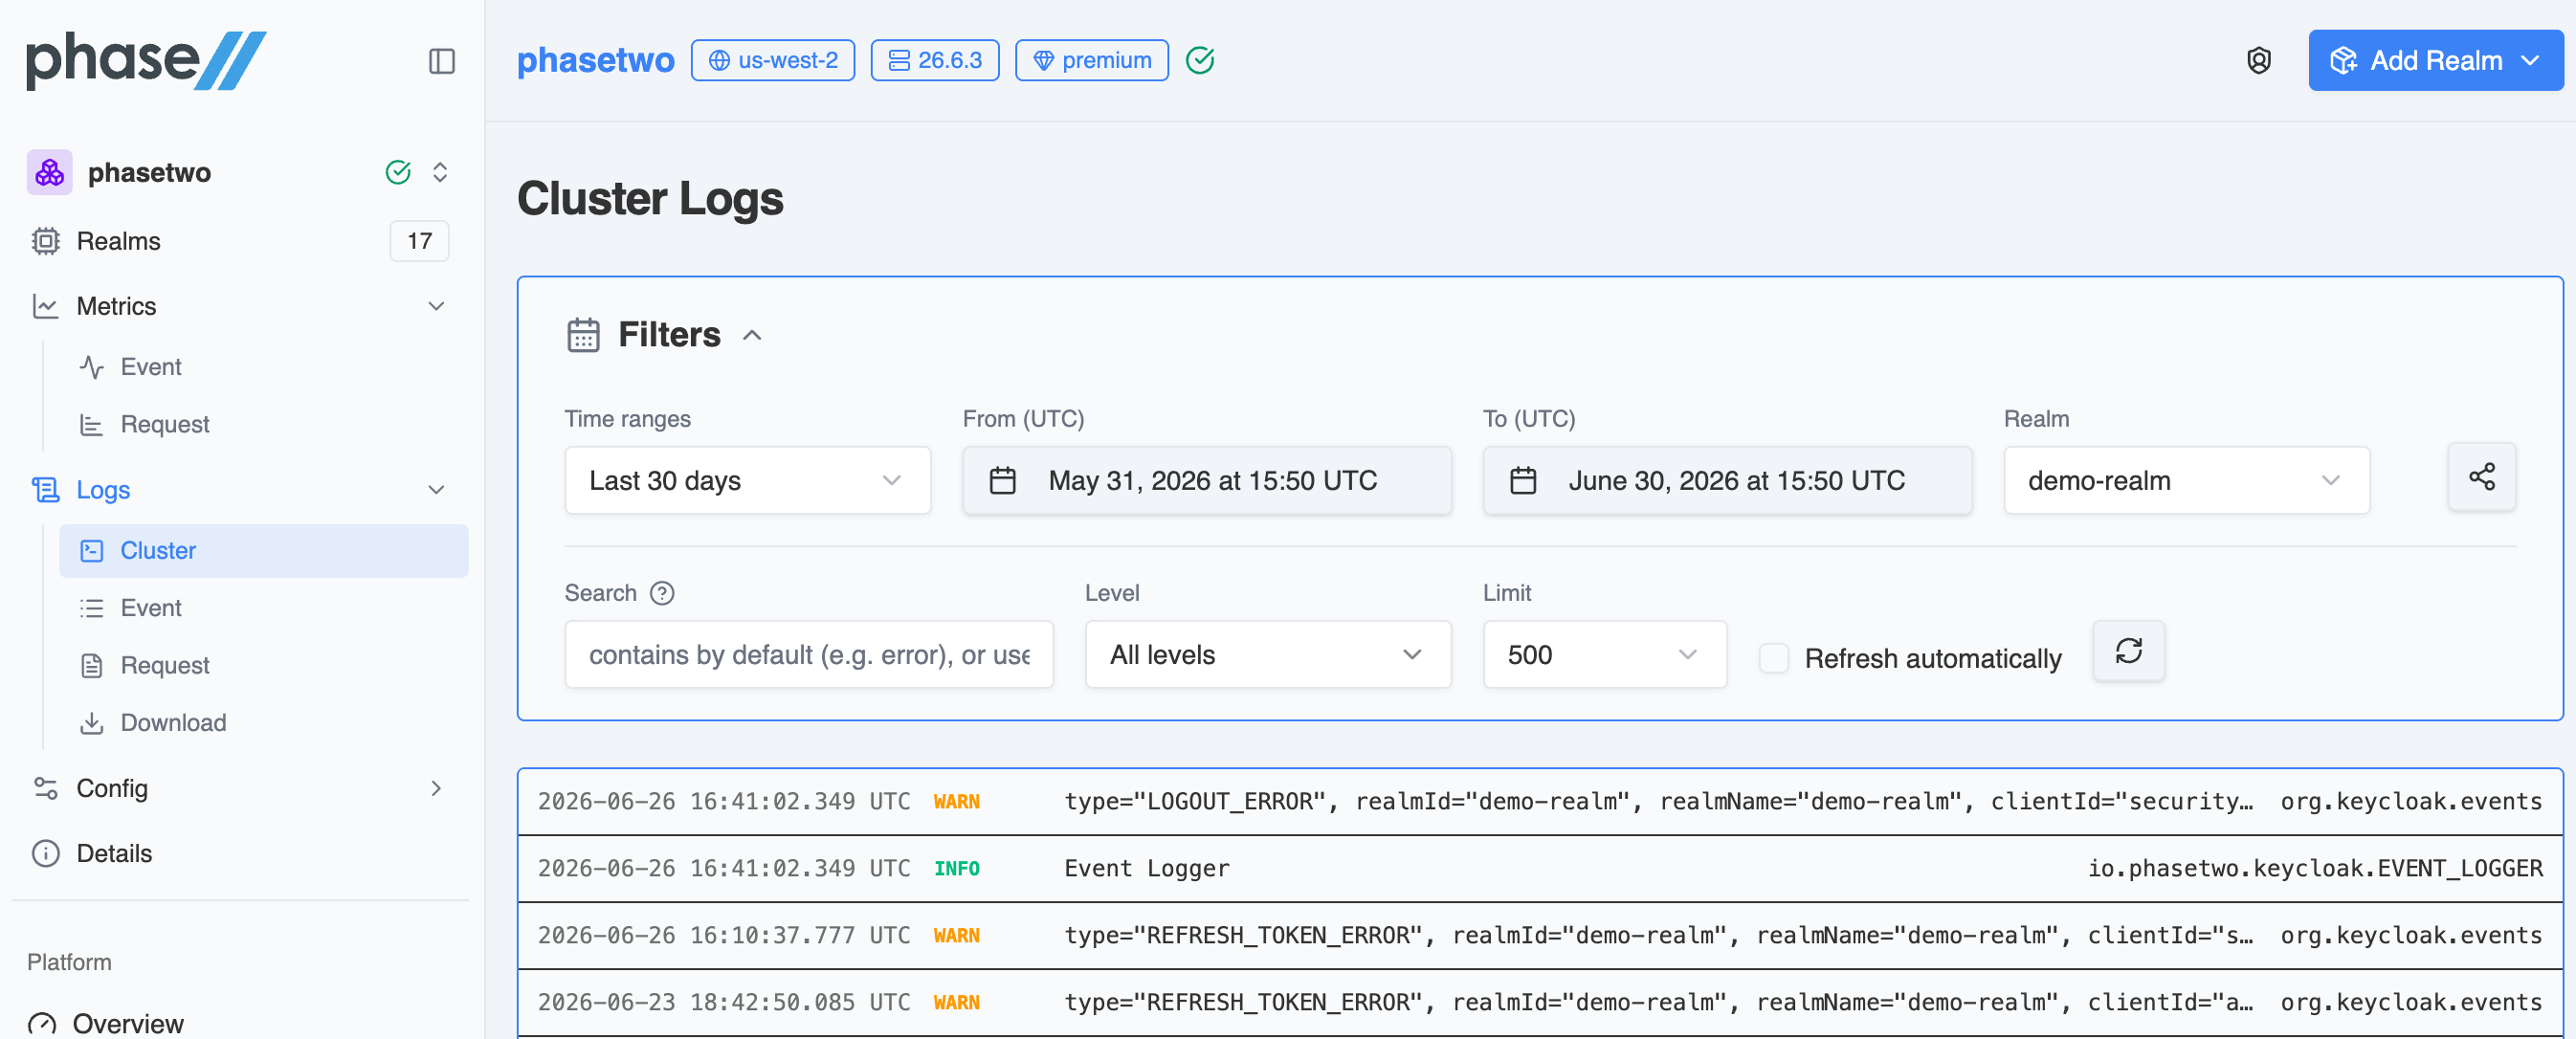
The streaming view gives you everything you need to chase down an issue without leaving the browser:
- Live streaming with auto-refresh, so new lines appear as they happen
- Realm and level filters (
INFO,WARN,ERROR,DEBUG,TRACE,FATAL) - LogQL-style search —
|=to match,!=to exclude,|~for regex. For example,|= "LOGIN_ERROR" != "admin-cli"finds login failures while filtering out a known source, and|= "NullPointerException"surfaces Java exception lines instantly. - Click into any line to open the full payload, logger name, and stack trace
What used to be a multi-hour, multi-person investigation becomes a few clicks.
What's included
Observability is split into two sections in the dashboard, both fully time-range and realm filterable, with all timestamps in UTC:
- Metrics — Event Metrics and Request Metrics: aggregated, charted views of authentication activity and HTTP traffic.
- Logs — Cluster Logs (live streaming), Event Logs, Request Logs, and Download Logs for retained files you can pull for offline review, auditing, or support cases.
This is the full realization of the observability work we previewed back in February, which started with log downloads. Live streaming, structured event and request views, and the metrics charts are all here now.
Why this matters
Running Keycloak yourself means running everything around it too — and the observability stack is one of the heaviest parts of that "everything." Phase Two gives you that layer for free, built in, from the moment your cluster comes up. Your team spends its time shipping authentication features and resolving issues, not building and babysitting monitoring infrastructure.
Zero setup. Requests, events, and logs in one place. Debugging in minutes. A production-ready, observable Keycloak cluster in the time it takes to read this post.
Ready to try it? Log in to the Phase Two Dash and open the Metrics and Logs sections on your cluster. Learn more in the Observability documentation. Questions? Reach us at support@phasetwo.io.