Metrics
Phase Two provides built-in metrics for dedicated clusters through the self-service dashboard. Metrics give you aggregated, charted views of authentication activity and HTTP traffic so you can spot trends, errors, and performance issues at a glance.
Visit your cluster in the self-service dashboard and open the Metrics section. It is split into two views:
- Event Metrics — authentication and admin activity derived from Keycloak events
- Request Metrics — HTTP traffic, errors, caching, and latency
All charts share the same filter bar (time range, realm, and refresh controls) and all timestamps are in UTC.
Filters and controls
- Time range presets:
Last 15 minutes,Last 1 hour,Last 6 hours,Last 24 hours,Last 2 days,Last 7 days, andLast 30 days - Custom time window: set exact From and To values
- Realm: limit results to a specific deployment/realm in the cluster, or view all realms
- Refresh: rerun the current query immediately
- Charts support zooming into a time window; use the reset control to restore the previous range
Event Metrics
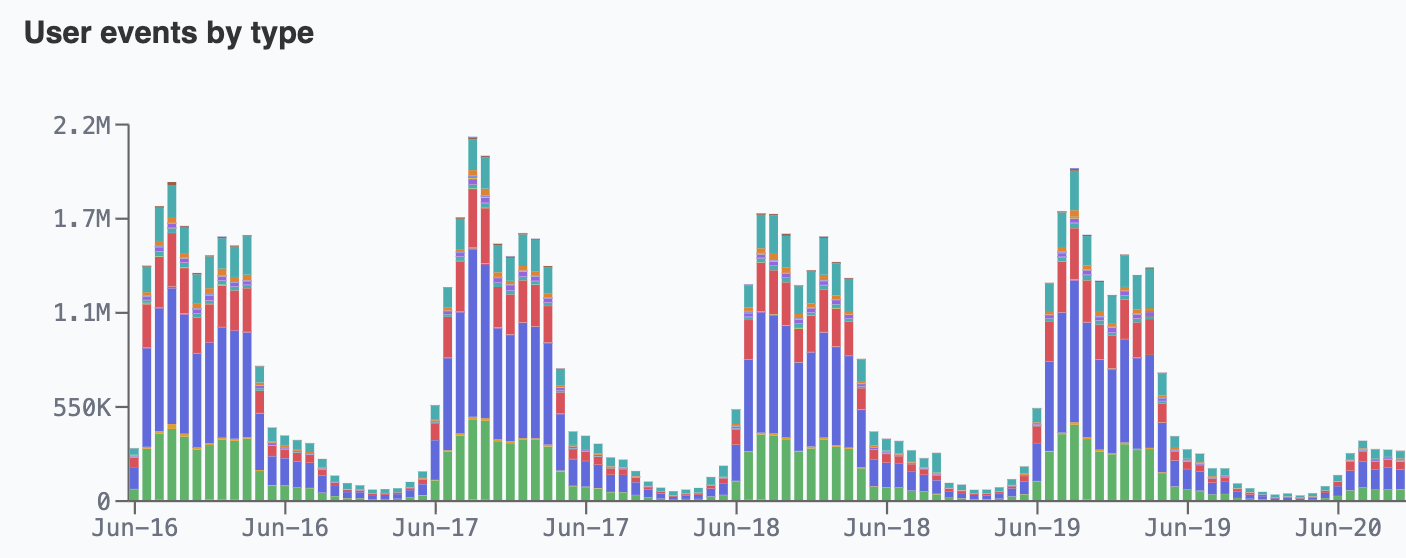
Event Metrics chart Keycloak user and admin activity over the selected time range:
- User events by type
- Admin events by resource / operation
- Successful logins
- Failed logins
- Active users per day
- New registrations
- Password reset requests
- MFA enroll / remove
- Login error reasons (lockouts)
- Session concurrency (proxy)
Request Metrics
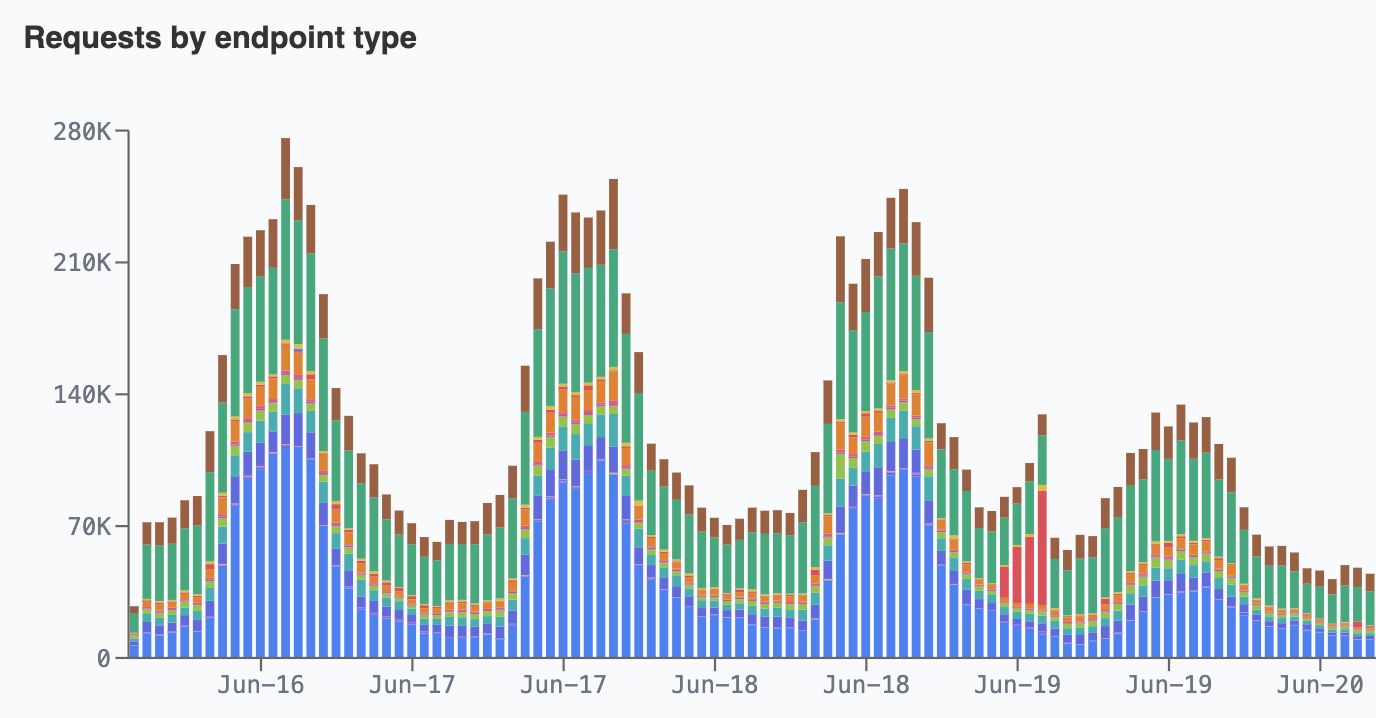
Request Metrics chart HTTP traffic and performance for the cluster:
- Requests by endpoint type
- Requests by HTTP status class
- Error rate (4xx + 5xx share)
- Cache hit ratio
- Latency p50 / p95 / p99 (
time_taken, seconds) - Latency p95 by endpoint type
- TTFB p50 / p95 / p99 (seconds)
- Bytes served
- Unique client IPs (approximate)
- Top endpoints
- Top user agents
Access notes
If you see a message saying metrics cannot be viewed due to lack of permissions, your account does not currently have access to that cluster's metrics. See Logs for log-level investigation of individual entries.